


All women experience metabolic changes during their menstrual cycle that a healthy body manages unnoticed. These changes include shifts in insulin sensitivity. As a Type 1 Diabetic, I operate my glucose metabolism exogenously and must respond to these changes consciously.
Insulin needs are often misunderstood as being simply relative to carbohydrate consumption. In reality, insulin is the body’s main anabolic hormone and a key player in ensuring our body functions properly even when fasting. Additionally, everybody has variable sensitivity to insulin so that the same dose can yield inconsistent results depending on many factors. This creates risks of insulin overdose or deficit.
I embraced insulin sensitivity as a moving target and became a master at tracking metabolic activities, environmental factors, other medications, circadian disruptions, and, most importantly, glucose readings. Still I struggled with sporadically inexplicable behavior of my glucose levels. As a user of Fertility Awareness-Based Methods of charting my cycle, I additionally track hormonal biomarkers, and combining these skills has allowed me to put my odd glucose excursions into a cycle context as they happen.
What Does The Research Say?
In 1942, researcher H.I. Cramer published his findings about the effects of the menstrual cycle on glucose levels. However, the extent to which cycle hormones interfere with insulin action is still poorly understood, understudied, and subject to the uniqueness of each woman’s natural cycle.
Presently, it is a common practice for doctors to prescribe Type 1 diabetic women the birth control pill when cyclical glucose variations become problematic. Synthetic hormones replace variability with predictability by shutting down the natural cycle. As a result, exact biological mechanisms that cause cyclical interferences in insulin response remain unclear.
Studies have yielded contradicting results specifically for estrogen in its relationship to insulin; estrogen has been implicated in insulin resistance while also having been identified as exerting a positive regulation on insulin action. A further positive association has been found between follicle-stimulating hormone (FSH) and insulin sensitivity. A third hormone player, progesterone, appears to impair glucose uptake causing temporary resistance to insulin during the luteal phase and pregnancy. This type of raw scientific information is deserving of further study. But until it is put into context for female patients, all these hormonal changes are rendered useless.
Sympto-Thermal Charting: A FABM Way To Anticipate Cyclical Changes In Insulin Sensitivity
Since I did not want to take the birth control pill, I began using FABM charting to give me insight into when my insulin sensitivity changes. I found that the female cycle provides remarkably clear biomarkers that can tell us about which hormone player dominates in terms of ratios and whether certain thresholds have been passed. This is possible because the presence of cycle hormones manifests in the quality of cervical fluid and waking temperature levels.
I track both the cervical fluid and waking temperature biomarkers using the criteria of the Sympto-Thermal Method. My charts over time, in combination with graphs from my continuous glucose monitor, revealed information about the effects cycle hormones had on my insulin sensitivity. With the help of my Diabetes nurse, I used this information to formulate four insulin dosing profiles applicable at different times in my cycle.
My Insulin Profiles Across My Cycle
What follows is an in-depth description of how charting my menstrual cycle with the Sympto-Thermal Method affects my insulin dosing profiles. While these details may sound like Greek to the average person without diabetes, those who do have diabetes can use this information, together with their healthcare professional, to see how it can apply to their individual situations.
My Standard Profile applies to all situations where my insulin response is relatively predictable. It is based on planned exercise and precise carb matching and does not cover surges in hormones. I use it on pre-ovulatory cycle days where my two Sympto-Thermal markers do not indicate a high state of fertility, i.e. cervical fluid of median fertile quality (short blue bar on my chart), or none. I also apply it on luteal phase days where I notice an estrogen peak (blue bar) in my chart.
My High-Sensitivity Profile is designed for cycle days where I see cervical fluid of highly fertile quality (long blue bar on my chart) before an ovulation attempt, and also during menses starting on cycle day 2. Low basal temperatures in correlation with highly fertile quality cervical fluid mark estrogen activity peaking and I reduce my basal insulin by 25% and my bolus insulin by 50% to avoid hypoglycaemic events due to increased insulin sensitivity.
Ovulation, the main event of the menstrual cycle, marks a turning point in my insulin sensitivity.
My Post-Ovulatory Profile accounts for a surge in progesterone that occurs following ovulation and that opposes estrogen during the luteal phase. Serum progesterone can fluctuate considerably in a 24-hour period so I set my basal insulin 20% higher but increase my bolus insulin incrementally throughout the day to a maximum of 40% higher in the evening where my progesterone tends to peak.
My High-Demand Profile covers the temporary insulin resistance that I experience at the end of my luteal phases and that extends to the first day of a new cycle. I increase my basal insulin doses as well as my bolus insulin by 30% each. Progesterone levels can let up briefly during my luteal phase manifested by a day of lower waking temperature and the occurrence of fertile type cervical fluid. I interrupt my High-Demand Profile on those days and apply my Standard Profile. This strategy has helped me eliminate severe hypoglycaemic episodes during my luteal phase. I stop using my High-Demand Profile as soon as my waking temperatures drop to pre-ovulatory levels, usually on cycle day 2.
My charts apply a visual icon language to represent cervical fluid in simple categories, relative to hormone activity. The short blue bar icon stands for cervical fluid of median fertile quality indicating some estrogen activity. The long blue bar icon expresses cervical fluid of highly fertile quality, the result of estrogen levels peaking. After Peak Day and ovulation, the yellow cloud icon means cervical fluid under the influence of progesterone associated with minor or major insulin resistance, depending on how high my temperatures rise.
Why Sympto-Thermal?
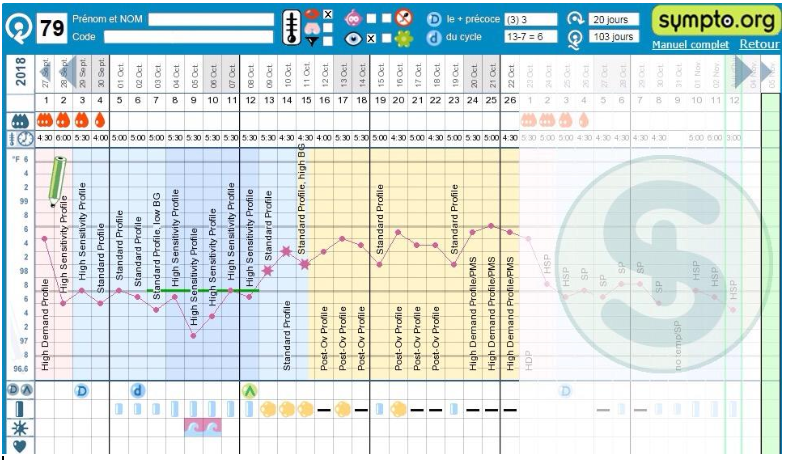
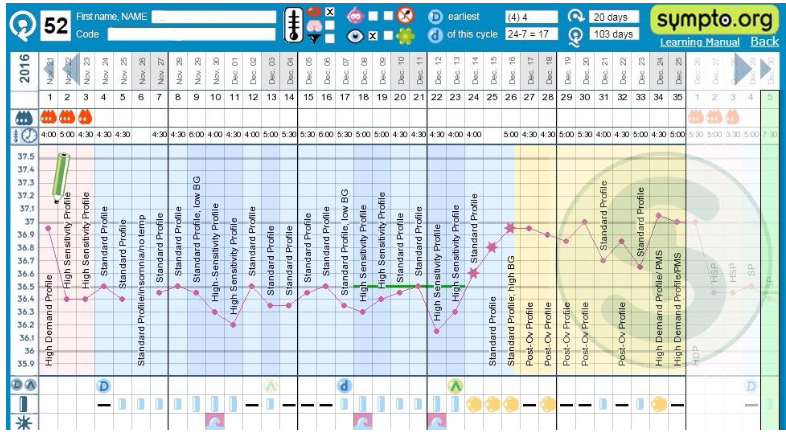
Key to applying my cyclical insulin profiles is ovulation confirmation. Without conclusive confirmation of ovulation, increasing my insulin dosage would pose an undue risk. Additionally, as a diabetic I am at pre-menopausal age where cycles can present irregularities. The Sympto-Thermal method allows me to clearly see my fertile waves as they happen each time my body makes an ovulation attempt, and confirm ovulation once it succeeds. Even if the attempt fails, it still puts me temporarily in a state of increased insulin sensitivity. I simply reset to my Standard Profile if the ovulation attempt did not succeed. Once I have a sustained shift in cervical fluid quality as well as a rise in temperatures, ovulation is confirmed and I can apply my post-ovulatory insulin profile. All my profiles allow for corrections but the idea is to eliminate the fluctuations caused by identifiable hormone shifts.
Chart #79 shows straightforward ovulation. Chart #52 shows a failed ovulation attempt followed by ovulation success later on.
FABM Charting Is An Advantage For Women With Type 1 Diabetes
The juxtaposition of Sympto-Thermal data with glucose trends allows me to detect surges in hormones giving me a heads-up regarding shifts in insulin response. Knowing why and when my insulin sensitivity shifts has been a game-changer for my Type 1 Diabetes by achieving flatter glucose curves and reducing stress associated with glucose excursions.
Even though complex, managing hormonal influences on glycemic control is possible without synthetic hormones such as those in hormonal contraceptives. FABM charting in a method that provides ovulation confirmation is a valid technique that deserves a place in research and diabetes education.
References
Cramer H, “The Influence of Menstruation on Carbohydrate Tolerance in Diabetes Mellitus.“ (1942) The Canadian Medical Association Journal , Volume 47(1), Accessed 1/11/2018 https://www.ncbi.nlm.nih.gov/pmc/articles/PMC1827245/pdf/canmedaj01692-0119.pdf
Gupte AA, Pownall HJ, Hamilton DJ; “Estrogen: An Emerging Regulator of Insulin Action and Mitochondrial Function.“(2015) Journal of Diabetes Research, Volume 2015, Article ID 916585, Accessed 1/11/2018 https://www.hindawi.com/journals/jdr/2015/916585/
Yeung EH, Zhang C, Mumford SL, Ye A, Trevisan M, Chen L, Browne RW, Wactawski-Wende J, Schisterman EF; “Longitudinal Study of Insulin Resistance and Sex Hormones over the Menstrual Cycle: The BioCycle Study.“ (2010) The Journal of Clinical Endocrinology & Metabolism, Volume 95(12): 5435-5442. Accessed 2/11/2018 https://academic.oup.com/jcem/article-lookup/doi/10.1210/jc.2010-0702

