Polycystic Ovary Syndrome (PCOS) affects 8-15% of women in their reproductive years and is the most common female hormonal disorder. Yet, it is historically underdiagnosed, and, like other female reproductive disorders, under-researched. PCOS is characterized by excess levels of androgens (testostérone being the primary one). Out-of-whack androgens lead to irregular ovulation, which leaves women with multiple small fluid-filled sacs growing on the surface of the ovaries. These fluid-filled sacs contain immature eggs, hence ‘polycystic’ (many cysts) ovary syndrome. Symptoms of PCOS include painful cramps, irregular cycles, acne, insulin resistance, infertility, obesity, and mental health symptoms.
Our ovaries produce the primary female reproductive hormones, œstrogène et progestérone, and we can indirectly observe the cyclical rise and fall of these hormones through observation of biomarkers like glaire cervicale et température basale du corps (BBT). Therefore, hormonal abnormalities in women with PCOS may lead to telltale patterns in fertility awareness method (FAM) charting, which involves tracking these biomarkers.
Instructors from Creighton/NaPro, FEMM, Boston Cross Check, Marquette, Billings, and Couple to Couple League were invited to submit written comments and/or charts for this article describing potential signs of PCOS in their respective FAMs. We have included all the input we received in the article below.
FEMM
FEMM stands for Fertility Education and Medical Management. FEMM charting is primarily focused on health maintenance, but it does include a family planning component. When a woman charts with FEMM, she watches for changes in cervical mucus and objective menstruation measurements. She also uses urinary luteinizing hormone (LH) strips to test for her LH surge, which immediately precedes ovulation. FEMM has an application that can recognize irregular patterns in charting and direct its users to a FEMM instructor and medical management if necessary.
According to the FEMM method, in which I’m a trained instructor, charts of women with PCOS will often include:
- Irregular cycle lengths (cycles longer or shorter than 24-36 days)
- Multiple attempts at ovulation (as seen through more than one series of increasing estrogenic mucus that appear to lead towards ovulation, but are not followed by a clear phase lutéale of continued dryness)
- Multiple LH surges that ne result in ovulation (as evidenced by no clear peak day following the surge, continuous cervical mucus, or no clear luteal phase)
- Short luteal phases (under 9 days)
- Sévère Symptômes du syndrome prémenstruel
It is common for women with PCOS to struggle with chronic low progesterone. Low progesterone affects the overall health of women along with their chances of conceiving and carrying a healthy pregnancy. Signs of low progesterone include short luteal phases (under 9 days), luteal phases that are not consistently dry, and multiple days of spotting or brown bleeding throughout the cycle.
Decoding the FEMM chart of someone who has PCOS

In this chart completed in the FEMM app, we see cervical mucus and menstruation observations. Grey bubbles indicate a dry day, light blue bubbles indicate a moist day, dark blue bubbles indicate a day of high estrogenic mucus (i.e., stretchy, clear, and/or slippery cervical mucus). Red days indicate menstrual flow, and pink days indicate spotting. ‘M’ stands for medium menstrual flow and ‘L’ is for light. As we can see, this chart does not demonstrate a clear, healthy pattern towards ovulation. There is no luteal phase in this cycle, and there were likely multiple attempts at ovulation.
Méthode d'ovulation Billings
Billings Ovulation Method instructor Theresa Larcina noted the connection between PCOS and insulin resistance. She shared “Hyperinsulinemia and associated insulin resistance can be identified on the chart by cycles with frequent (even continuous) mucus patches or continuous estrogenic mucus (sensations of wetness, clear watery mucus) in the chart but a lack of confirmed ovulation.”
Furthermore, “there may still be periodic bleeding which the woman interprets as her ‘period.’ This however, is ‘withdrawal bleeding’ rather than true menstruation.”
Larcina distinguished, “Menstruation is the bleeding that occurs 11-16 days after ovulation when conception has not occurred. ‘Withdrawal bleeding’ is bleeding which occurs because the endometrium (uterine lining) is not maintained due to ‘withdrawal’ of hormones. Withdrawal bleeding may be lighter than normal or the same as menstruation. Or, there may just be breakthrough bleeding occurring on random days in the chart.”
Boston Cross Check
Boston Cross Check teaches women how to chart cervical mucus, monitor hormonal levels, and monitor basal body temperature. The woman then has the option to choose which biomarkers to use.
PCOS, similar to endometriosis, can manifest very differently for each charting woman. In some cases, it may be already well-managed by diet or medication. According to Boston Cross Check instructor Mikayla Dalton of Fig Leaf Fertility, not all PCOS clients will exhibit the same symptoms, but charting signs that women with PCOS may have include:
- High variability in cycle lengths, oscillating between short and long cycles
- Anovulatory ‘cycles’
- Very long cycles
- Multiple LH positive results which are not all ovulatory, or high “baseline” levels of LH
- Elevated estrogen – leading to multiple cervical fluid patches up to constant fertile fluid signs, or many monitor high estrogen readings (if using the Clearblue fertility monitor)
- ClearBlue monitor “peak” readings that are pas actually ovulatory
- Many episodes of hormonal (non-menses) bleeding throughout the cycle
A note about postpartum PCOS Boston Cross Check charts
Dalton observed, “I have noticed among my clients that some with PCOS who return to charting after having a baby sometimes notice that their charting signs of PCOS do not reappear, and other signs of the condition do not reoccur. It just… ‘goes away’, and, as far as I hear, they never need to pursue diet/supplement/medication treatments again. Some have a typical experience of the postpartum transitional cycles and then may experience some normal regular cycles before the charting signs of PCOS gradually return and eventually lead them to pursue treatment. And some never experience regular cycles post-baby, and when fertility returns, they go right back into disturbed cycles.”
Méthode Marquette
Le Méthode Marquette, which is primarily a urine hormone monitoring-based method, was originally developed for use with the Clearblue fertility monitor, which tests for urinary estrogen and LH levels. However, the method protocols are being revised to alternatively use the new Moniteur Mira, which also tests for changes in urinary FSH (follicle stimulating hormone) and progesterone (PdG), in addition to urinary estrogen and LH.
PCOS ‘red flags’ in the Marquette Method
According to Marquette Method instructor Annie Norton of Simplement PFN, “PCOS is a condition that, sadly, isn’t uncommon among my clients. There are some telltale signs that, if we discover them, cause me to link the client up with a wonderful NaPro doctor that I know and trust who can investigate further and then diagnose and treat PCOS if that is what’s going on.
Norton continued, “The first PCOS ‘red flag’ is long or irregular cycles. This can be cycles lasting longer than 35 days, or missing periods altogether (creating very long cycles). Another sign I might look for is abnormal menstrual bleeding (lasting longer than the typical 7 days), or spotting between periods. Another symptom that I look for is specifically brown spotting between periods. These are all signs that PCOS may be the culprit.
Norton added, “Of course, PCOS may cause infertility as well, so if the couple is having sex during their fertile window frequently and not getting pregnant, and if she is experiencing any of these symptoms, a visit to a NaPro physician may be appropriate.”
Why women with PCOS may benefit from using the Mira vs Clearblue monitor
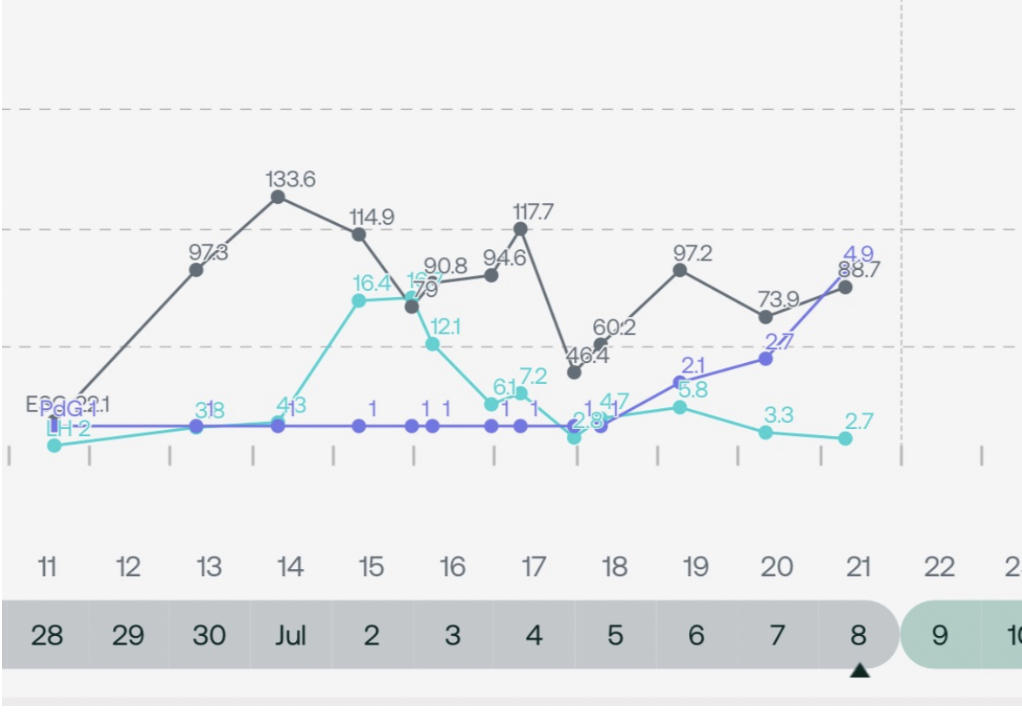
According to Norton, “Looking at Marquette charts specifically, women with PCOS often have hormonal fluctuations and may miss their peak LH surge. I’ve seen progesterone rise be sluggish in these charts, and some women with PCOS have lower progesterone thresholds. Using the Mira analyzer has been very helpful for some of these women because we can identify their specific progesterone trends, and monitor closely to confirm ovulation post LH surge.
Norton notes, “Some women with PCOS will have LH surges (picked up by either their Clearblue monitor or Mira) that don’t result in ovulation (evidenced by no thermal shift or PdG rise). Then they end up having a subsequent LH surge later that fait result in ovulation. This is why the progesterone component is very helpful in charting. We can close out the fertile window once the protocols are reached, and the couple can be confident that ovulation did indeed happen based on PdG.”
Decoding the Marquette Method chart of someone who has PCOS

Per Norton, “This chart shows an LH surge plateau, followed by a sluggish PdG rise (LH is light blue, PdG is purple, estrogen is gray). This client has a history of PCOS, and if she were not tracking PdG, she would have possibly ended her fertile window too soon, and pregnancy could have possibly resulted. Her goals were TTA this cycle, and she was successfully able to accomplish those goals by tracking her LH and PdG accurately.”
Couple to Couple League (CCL)/ The Symptothermal Method (STM)
Le CCL/STM method observes three different biomarkers: cervical mucus, cervical position, and basal body temperature. The PeakDay app was developed by Couple to Couple League. It can be used for any FAM/NFP method, but it was created specifically with the CCL/STM method in mind.
Decoding the Symptothermal Method chart of someone who has PCOS

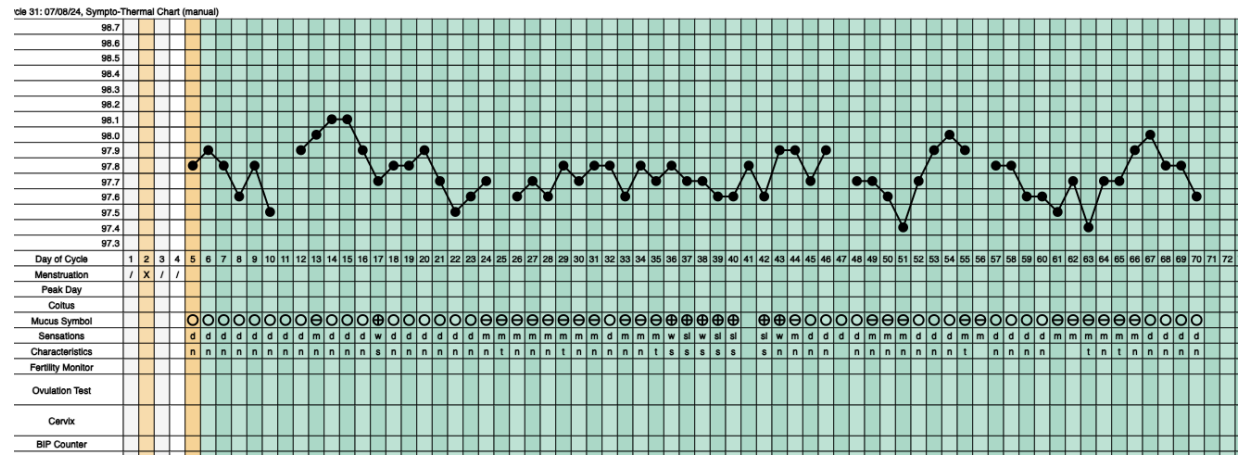
In the above chart, which is a classic Symptothermal Chart, the connected plotted points represent basal body temperature data points. Typically, one expects to see a cluster of lower temperature points preovulation, followed by a cluster of higher temperatures postovulation, indicating the thermal shift that occurs under the presence of the postovulatory progesterone surge. The bubbles underneath the temperature plot are a recording of the woman’s daily mucus observations, with open bubbles indicating nonfertile dry days, “theta” bubbles indicating more fertile moist days, and bubbles with a cross indicating the most fertile stretchy, clear, and/or slippery cervical mucus days.
According to CCL instructors Seth and Elizabeth Timpe, in the above chart, we can see the reality that “there are no consistent temperature shifts and/or mucus patterns in PCOS charts. Clients often go months in between bleeding and experience lots of continuous mucus.”
Le bilan
PCOS is a common female reproductive disorder that often goes undiagnosed. When left untreated, PCOS can affect a woman’s quality of life, fertility, and overall health and well being. Charting using an evidence-based fertility awareness method can help you recognize symptoms of disorders, such as PCOS, in a timely manner for proper diagnosis and effective disease management, especially in the hands of a restorative reproductive medicine-trained healthcare professional.


